Get started on your KPI Tree
When it comes to focus, goals and alignment, it can be pretty tough to ensure that everyone is on the same page. But don't worry, that's where a KPI Tree 🌳 comes in!
This very simple (yet powerful) tool can also help you navigate KPIs and metrics, allowing you to focus on areas where you can truly deliver impact ✨
In this article, we will explain everything about KPI Trees and provide a guide on how to build one for your own team 👌
🌳 What is a KPI Tree?
Simply put, a KPI Tree is a visual representation of the Key Performance Indicators (KPI) and metrics that are important to your organization.
It's a hierarchical structure that begins with an important metric at the top and then breaks down into more specific metrics as you go down the tree.
Let's jump into an example:
Imagine a product where users can subscribe to different content creators (like Patreon, Substack or MYM). The total number of Subscribers or 🧑🏼🤝🧑🏾 # Subscribers (= users having at least one ongoing paid subscription) is an important KPI, that we can break down into more metrics:
1️⃣ In the simple example above, we start with the 🧑🏼🤝🧑🏾 # Subscribers (= total number of subscribers) KPI. As we go down, we split it like a math equation:
# Subscribers = # MAU * % Subscription Rate
2️⃣ Then we can continue and focus on one of the KPI below. For example, we’ll look at the Monthly Active Users or 👀 # MAU which us a super important metric, and split it further.
One way to split MAU can be:
Once again we can outline a math equation:
# MAU = # New Users + # Returning Users + # Reactivated Users
Where we can define:
👀 Monthly Active Users = users who had at least one session in the past 30 days
🐥 New Users = users who registered (created an account) in the past 30 days
🦅 Returning Users = users who already had and account and had at least one session in the last 30 days
🦤 Reactivated Users = users who stopped using the product and came back in the past 30 days
By going down the layers of KPI, we can see how lower metrics contribute to the higher goal, and how they are all connected.
Different teams can act on different metrics, and this approach enables everyone to identify where and how they can have impact and contribute to the overall goal.
🤔 Why should I care?
With a KPI Tree 🌳, you can:
1️⃣ Transform chaos into simplicity 🌪️→☀️
🔢 Organize your (possibly many) metrics and understand how they relate to each other
🔗 Identify dependancies
🌈 Bridge the gap between company goals (the top KPI), product metrics and customer behavior (hypothetical branches)
2️⃣ Explore opportunities 👩🏽🚀
🔎 Identify areas for improvement: by tracking the right KPIs, you can identify where you can do better
⚖️ Prioritize through data-driven decisions
3️⃣ Foster alignment and focus 🎯
🙌 Promote transparency: a KPI Tree ensures that everyone has visibility into what's important and how their work contributes to the overall success of the organization
😇 Evangelize the importance of tracking metrics
🪄 Great for visual communication, works wonders in presentations, roadmaps and monthly reports!
✨ Finally, the goal of a KPI Tree is to help find where you can have the maximum impact for your product and company.
🪵 Two kinds of branches: mathematical and hypothetical
Now, let's delve deeper into the subtleties.
So far, the branches in our example are very much focused on mathematics. They either rely on:
a simple equation
🧑🏼🤝🧑🏾 # Subscribers = 👀 # MAU * 🏉 % Subscription Rate
or an obvious user segmentation
👀 # MAU = 🐥 # New Users + 🦅 # Returning Users + 🦤 # Reactivated Users
We’ll call them mathematical branches.
There is another kind of branch we can use: the hypothetical branch.
Let’s continue growing our tree. We’ll take the 🐥 # New Users, that we can split into two segments (another mathematical branch):
# 📣 Paid Users = users acquired through ad campaigns
The marketing team launched ad campaigns on various social medias platforms (such as Facebook, Instagram or YouTube). Users that registered after seeing these ads are considered paid users
#👂 Organic Users = users who registered by themselves
Suppose we want to determine the source of our organic users. Through user research, we can inquire about how they discovered our product.
For example, at MYM, we conducted this user research by presenting a simple form to several hundred new users:
After analyzing the results, we have identified the main sources of our organic new users:
👸 Creator: some Creators already had a large audience on another platform (usually Instagram). When they created an account on MYM, they encouraged their users to follow them
📺 Media: as MYM generated buzz on TV and in the press, it naturally attracted users.
🌐 Other: the two items mentioned above were the main sources of organic users, so we grouped the remaining sources into this third category.
→ we added these results in our KPI Tree, indicating with a dotted line that they’re hypothetical:
Hypothetical branches have some specificities:
As we deepen our understanding of our users, we can change or update these branches more frequently
Here are a few examples of techniques that can be used to grow a hypothetical branch:
💬 User interviews
📄 User surveys
🔎 Analysis of product usage data
👂 Interviews with your internal Customer Success or Sales team
If we haven't conducted the research yet but have some hypotheses, it's perfectly fine to add them to the tree as they are! That’s what the dotted line is for.
✨ Both mathematical and hypothetical branches are valid, and both are important. If you ever get stuck while building your tree, you can try both approaches to see what works best.
🌱 How to Grow a KPI Tree
🌱 Where do I start?
You probably fall into one of these two cases:
1️⃣ Your company or team has clear goals and OKRs
➡️ Congrats! If you’re lucky enough to have a clear North Star metric, start there. Other top-of-the-tree metrics from your OKRs are also a good starting point.
2️⃣ Your company or team has yet to define clear goals and OKRs
➡️ Don’t worry! It’s actually a pretty common scenario, and also a good opportunity to pave the way for a more metric-driven approach. In this case, begin by identifying a significant metric for your team, such as a customer metric or stated business goal. Another way to nail down your first metric is to ask yourself: “what does success look like?” and then translate the answer into a KPI. This KPI may not be your final company top of the tree, but you can build your tree upon it later.
If you need to brainstorm some KPIs, you can also take a look at Lenny’s Newsletter top articles around metrics 👌
Once you’ve nailed down your first KPI, you can start populating the tree. Keep in mind that this will be a messy process and that the KPI Tree is a living thing that will evolve other time!
💰 Should I include revenue in my KPI Tree?
That's always the tricky question when it comes to product and KPIs!
🤛 On one hand, building better products should not solely revolve around generating revenue as your main goal.
🤜 On the other hand, the purpose of the product should be to serve customers in ways that are financially viable for the business.
So, while a KPI Tree shouldn't be 100% revenue-focused, it can still display how the KPIs contribute to revenue.
One way to achieve this is by displaying revenue as the fruit produced by the Tree. It can be combined with visually less prominent elements, such as using a grey color:
In short:
✅ Add revenue to your tree if:
Your product scope has a direct impact on revenue. For example, Duolingo has a product team responsible for optimizing in-app purchases. Naturally, their main KPI is app revenue!
You want to collaborate with your business teams to jointly build and utilize the KPI Tree. If there is no mention of revenue, they may not consider the KPI Tree to be very relevant for them.
The economic context is tough, and it’s impacting your company's future. Generating additional revenue is now a question of survival
❌ Don’t mention revenue if:
Your company has already defined non-revenue KPI / north star
Your product scope does not have a direct impact on revenue
👩🌾 Who should be involved in building the KPI Tree?
The KPI Tree is a great tool to build collaboratively. A rule of thumb is that your should build your Tree with the same people you want to be adopting the Tree later on.
You can invite:
For a company-level KPI Tree → ✨ Product, 🐲 Top management, 💼 Business (Marketing, Customer Success)
For a product-level KPI Tree → ✨ Product, 🐲 Top management
If you have a 📈 Data department, you should definitely involve them as well!
If the time is not right or if you are not in a situation to take charge of your company’s KPI Tree, it can still be beneficial to build your own. It’s a great exercice and can be beneficial to better understand the interconnection of your product metrics.
🎁 Workshop Template
To help you get started with your own KPI Tree, you can use one of the following templates:
🎁 KPI Tree Workshop (Miro)
KPI Tree template (Whimsical)
Check out the KPI Tree Workshop (Miro) for some tips on how to successfully workshop your KPI Tree!
How will you know that you have created a good KPI Tree ? When you introduce it to someone new, and they can grasp how to read it with just about five minutes of explanation.
🌀 When to use in the Product Cycle?
Now that you get how to build a KPI Tree, you might be wondering: WHEN should I use it?
Here are three interesting scenario:
🎬 Scenario #1 = 🗺️ Roadmapping (aka preparing the roadmap)
If you have clear top-of-the-tree KPI goals for the quarter (for example, increase MAU by 30%), you can hold a brainstorming session to select ideas that will impact the selected KPIs
On the opposite side, if you’re expected to propose your own roadmap and goals, you can assess feature ideas (based on user research and discovery) against your KPI Tree to determine what higher metrics you’re gonna impact. Then, you can craft a roadmap proposal based on the potential for higher impact
For example: in our product, we can have a separate KPI Tree for Creator users (with a different color), because they have a separate registration process to create their account.
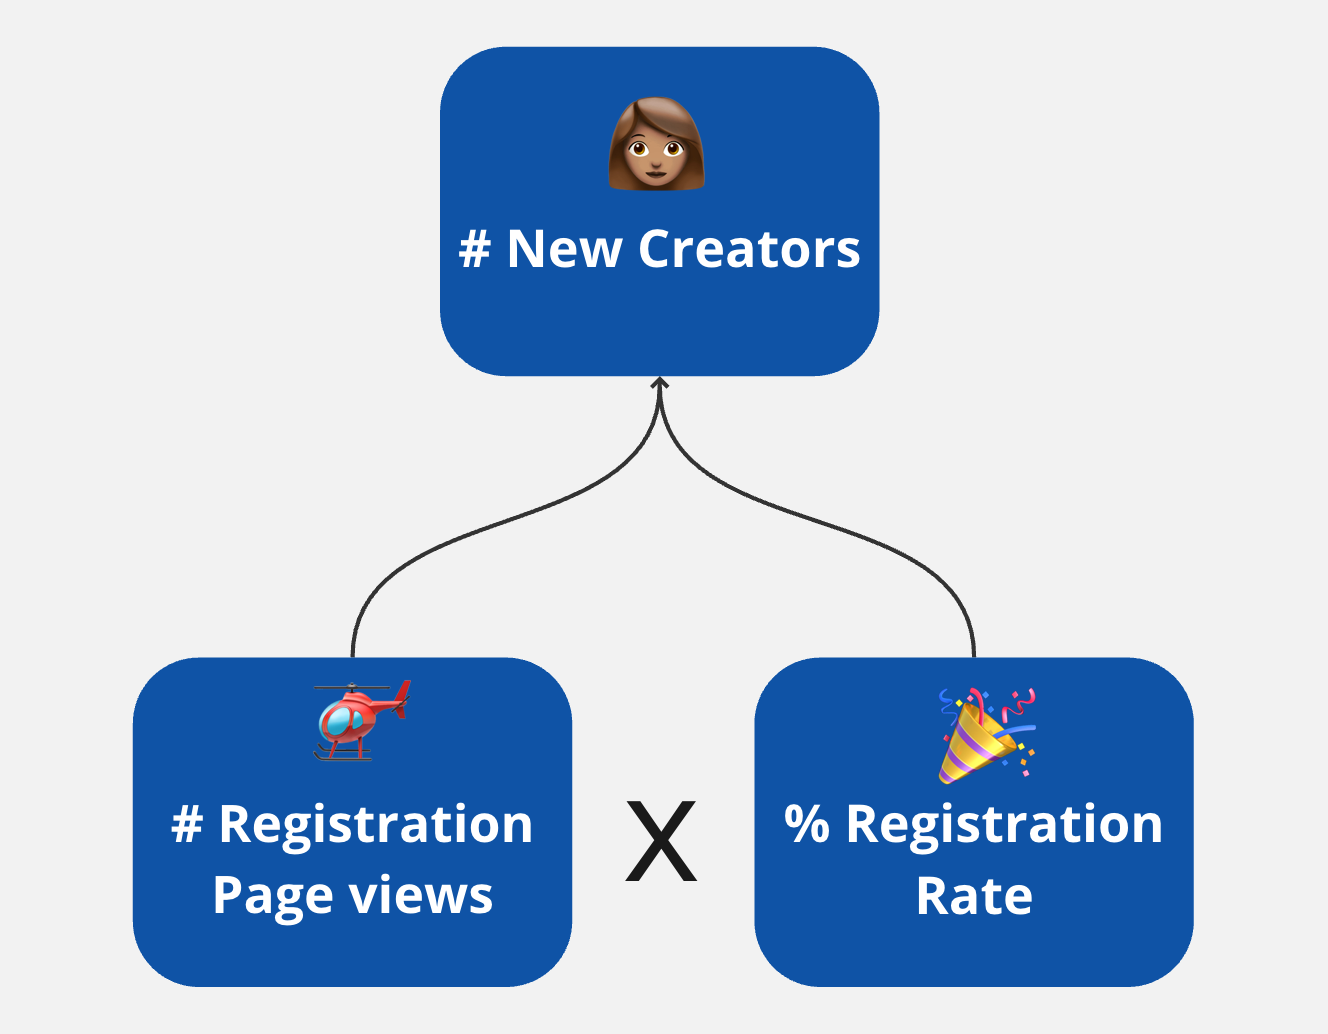
Just like before, the number of # New Creators can be outlined by a simple math equation:
# New Creators = # Registration Page Views * % Registration Rate
Let’s say that the 🎉 % Registration Rate is really low, meaning lots of potential Creators are starting the funnel with the intent to register, but too few go through all the steps to actually validate their account creation.
We can follow up with an analysis of the registration funnel through data and user research, and quickly identify obvious frictions, discouraging Creators to complete their account creation. There can be poor UI involved, alongside with bugs and overall too many steps.
We can then brainstorm solutions with the design and engineer team, and prioritize them in the roadmap
.
🎬 Scenario #2 = 📈 Pulse-check reporting
Because it’s visual, the KPI Tree is a good tool to share the monitoring of your metrics with your team.
Every month or quarter
Once you’ve crafted your data reporting including the KPI Tree, two possibilities:
Share it asynchronously with your stakeholders
Use some time of a recurrent meeting (such as a weekly team meeting or a daily meeting with your product squad) to spend 5 minutes reviewing the reports together. This practice can have a transformative effect on instilling a data-driven culture within your team!
🎬 Scenario #3 = 🩺 Root cause analysis
If a metric isn’t performing well, such as a decrease in MAU, you might want to understand the root cause. The KPI Tree comes in handy to pinpoint which sub-metric is involved. This will help to understand the underlying reason for the decline
It might also be interesting to identify the root cause of good performance, which can actually hide a mix of performance in the sub-metrics involved.
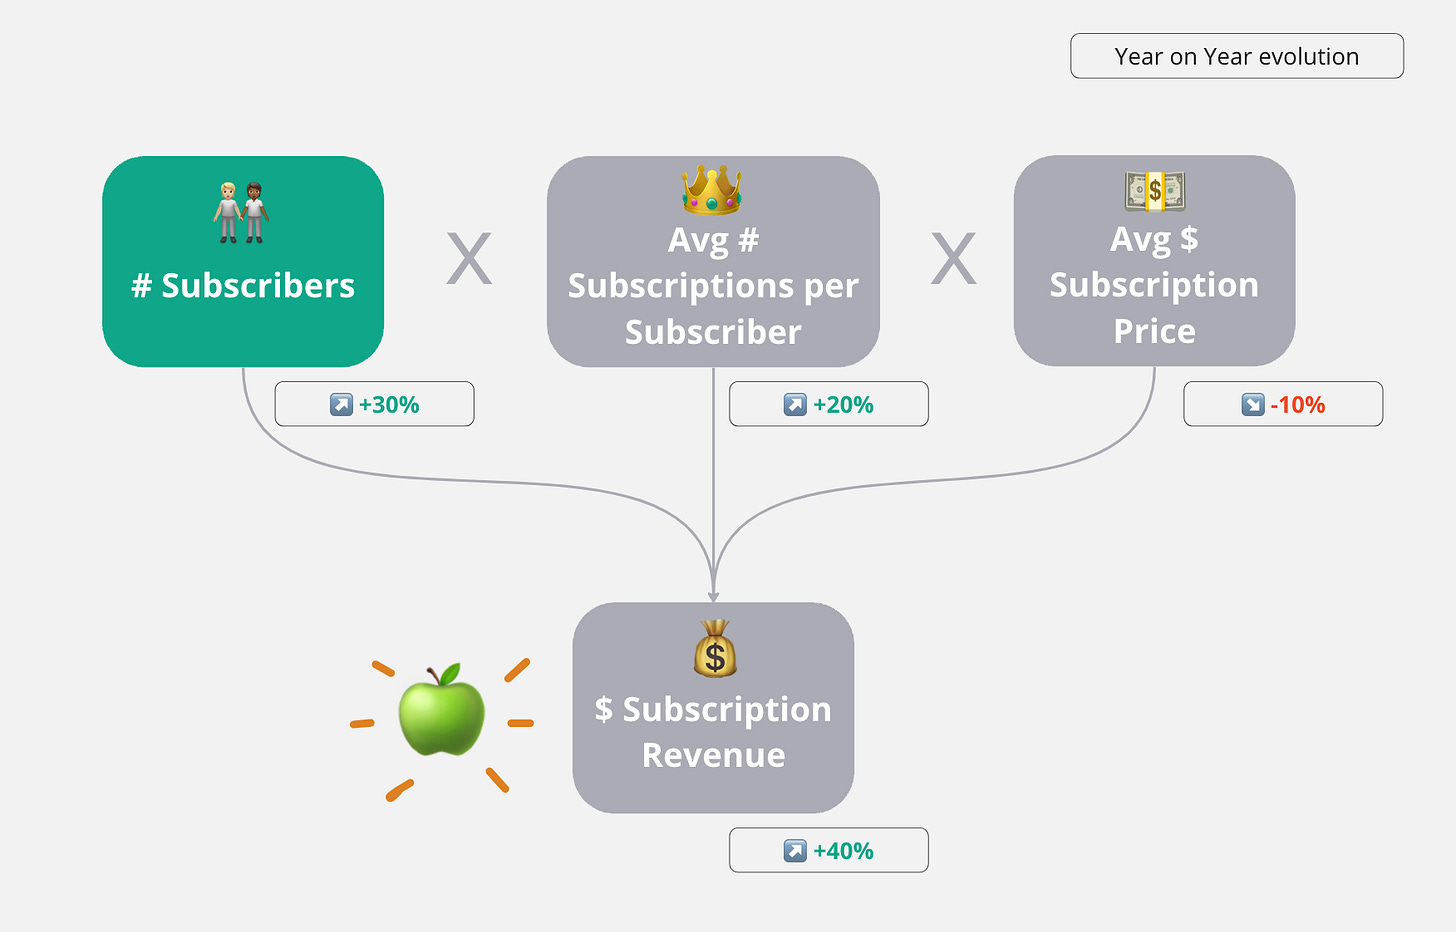
Let’s continue with our example, and imagine that the revenue from subscriptions is going up. The equation is:
$ Subscription Revenue = # Subscribers * Avg # Subscriptions per Subscribers * Avg $ Subscription Price
In that example, we had the following evolution year on year for the sub-metrics:
While the 🧑🏼🤝🧑🏾 # Subscribers and 👑 Avg # Subscriptions per Subscriber were steadily growing, these good numbers were hiding the fact that the 💵 Avg $ Subscription Price had actually decreased!
And it was all induced by a new feature: vouchers. This feature allows Creators to offer discounts to their subscribers. Despite this, the outcome was still positive because we can assume that the vouchers also encouraged users to subscribe more.
🎀 Tips
Congrats, you got all the way to the last part!
Here are a few tips to make your KPI Tree even better:
Use clear names for you metrics (which you can definitely document in a product/data glossary with their full definition)
Add examples of values for clarity
For each branch (mathematical and hypothetical), try to adhere to the MECE principle, which stands for Mutually Exclusive, Collectively Exhaustive. This means that every single individual should belong to one and only one category. For example with users:
an organic user either came from a creator, or from media (but not both, or we’d count it twice)
a MAU is either a new user, returning user or reactivated user
Some visual tips:
Use bigger lines vs smaller lines for the most impactful metrics
For a given feature, highlight which metrics will be impacted
Example:

Add emojis for fun! 🦊
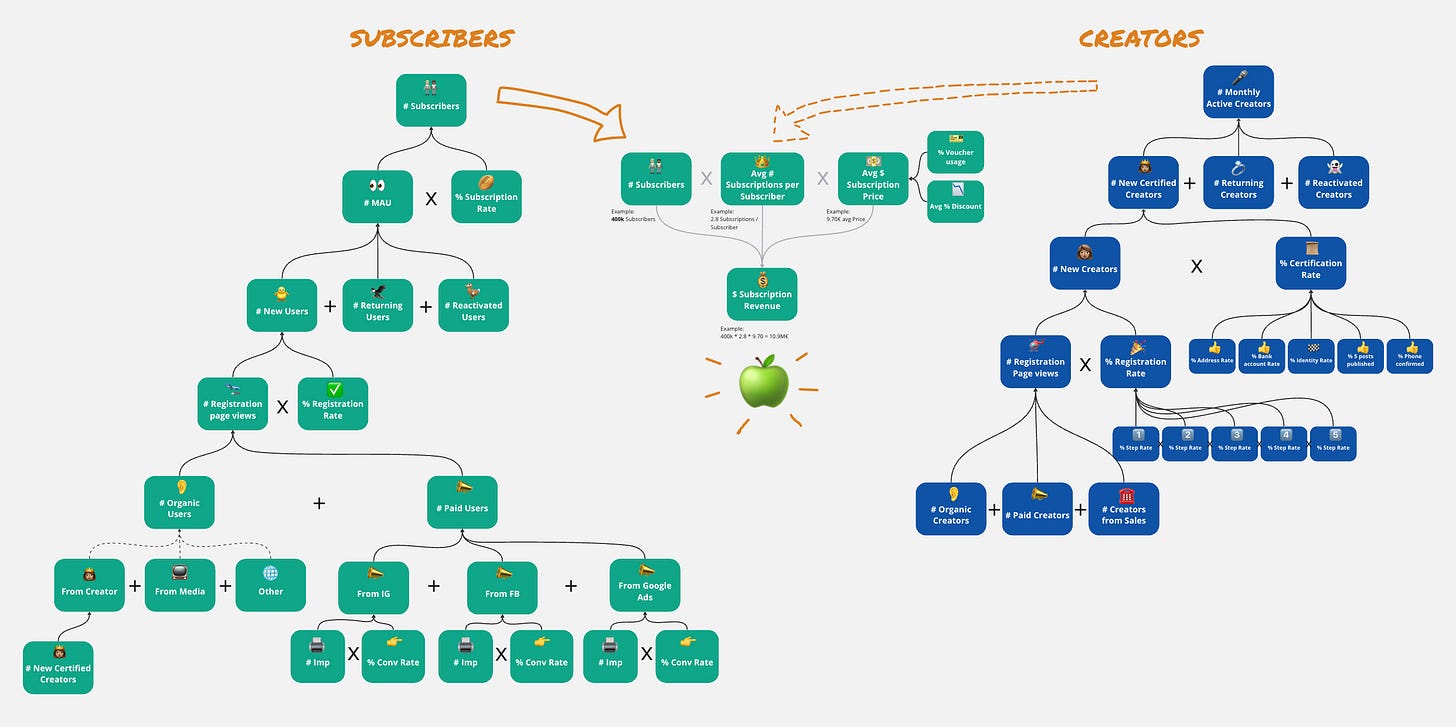
If you wonder what a full KPI Tree looks like, here is an example:
✨ Conclusion
In conclusion, a KPI tree is a powerful tool for anyone dealing with KPIs that can help you foster alignment, transparency, and focus within your organization. By defining your company's goals, identifying the right KPIs, and organizing them into a hierarchical structure, you can ensure that your team is working towards the same objectives and delivering value to your customers.
Happy KPI Treeing!
📚 Ressources
KPI Trees: How to Bridge the Gap Between Customer Behavior, Product Metrics, and Company Goals (Petra Wille | Jan 2022)
KPI trees for root cause analysis (Rezwan Hoppe-Islam | Feb 2021)
How Duolingo reignited user growth (Lenny’s Newsletter | Feb 2023)
How Duolingo builds product (Lenny’s Newsletter | March 2023)
The best of Lenny’s newsletter → Benchmarks and metrics (Lenny’s Newsletter | Dec 2022)
The guide to discovering your product’s North Star (Amplitude)
Choosing Your North Star Metric (Lenny’s Newsletter | June 2021)


